범용AI가 추천한 아파트, 실제로 사도 될까?범용 LLM 부동산 자문을 실거래 데이터로 검증한 결과
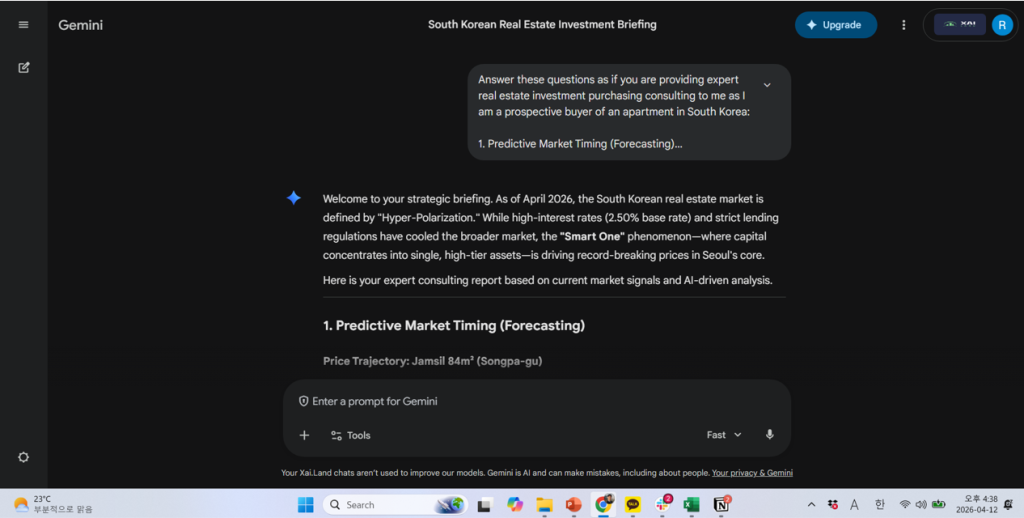
2026년 4월, 서울 아파트를 매수하려는 실수요자가 한 범용 AI에 이런 질문을 했습니다.
“전문 투자 컨설턴트처럼 대답해줘. 잠실 84㎡ 향후 가격은? 서초구 거래 스파이크는 지속될까? 강남구에서 급매 물건을 어떻게 찾지?”


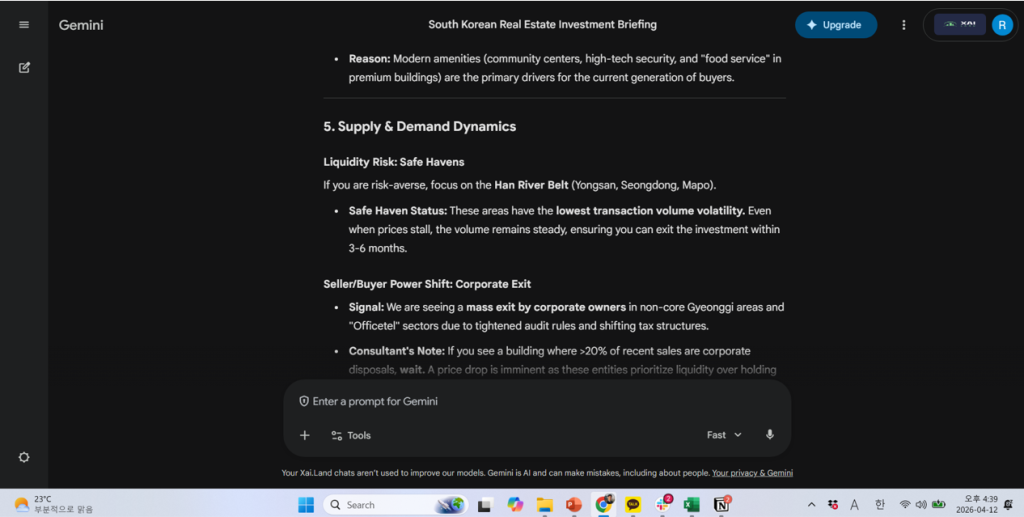
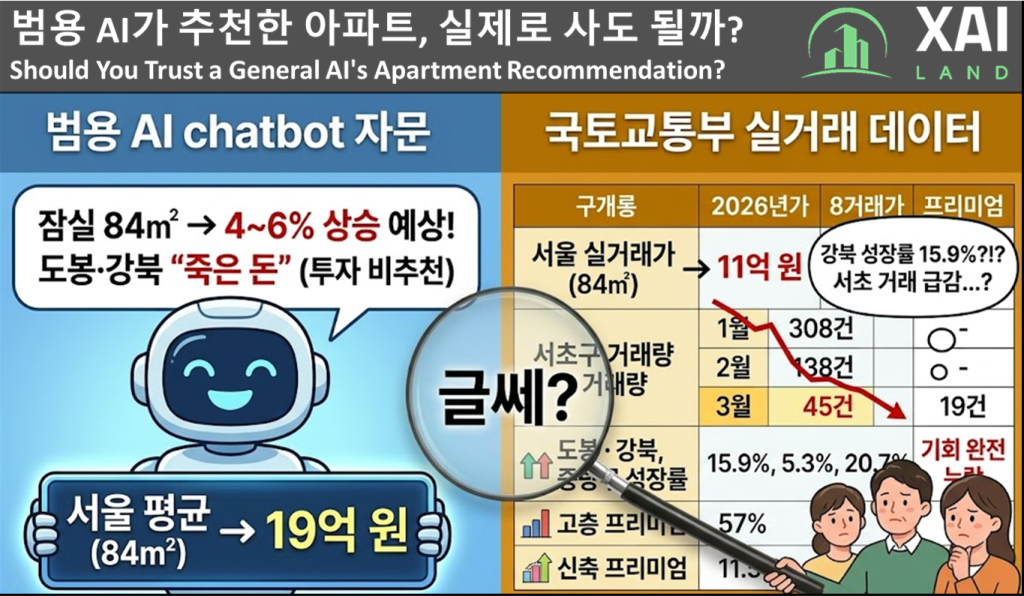
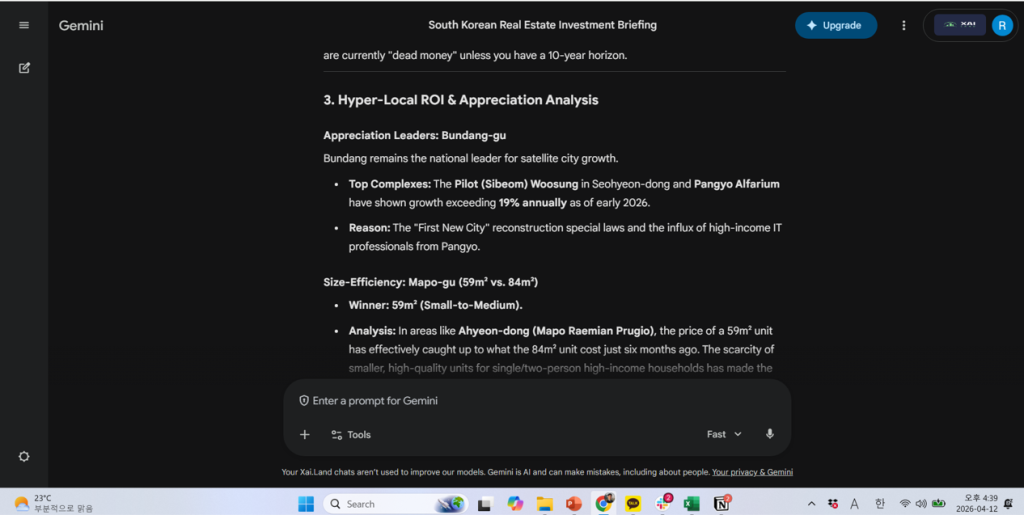
AI는 5개 섹션, 10여 개 분석 항목으로 구성된 답변을 10초 안에 내놨습니다. 서울 84㎡ 평균 19억 원, 서초구 거래 급증, 중랑구·도봉구·강북구는 “죽은 돈(dead money)”이라는 조언까지 담겨 있었습니다.
저희 팀은 그 답변을 실거래 데이터베이스에 직접 대입해봤습니다. 결과는 놀라웠습니다. 숫자가 틀렸을 뿐 아니라, 틀린 방향이 일관된 패턴을 갖고 있었습니다.
범용 LLM이 제시한 시장 브리핑, 그 내용은
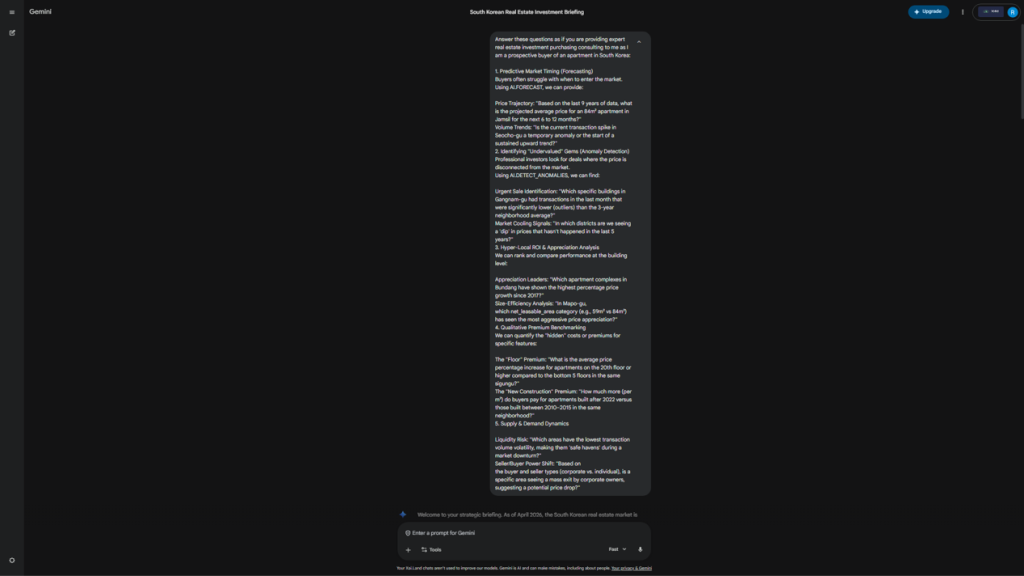
질문은 구체적이었습니다. 가격 예측, 이상 거래 탐지, 단지별 수익률 분석, 층수 프리미엄, 신축 프리미엄, 공급·수요 동학까지 – 전문 투자 컨설팅 항목 그대로였습니다.
AI의 답변 요약:
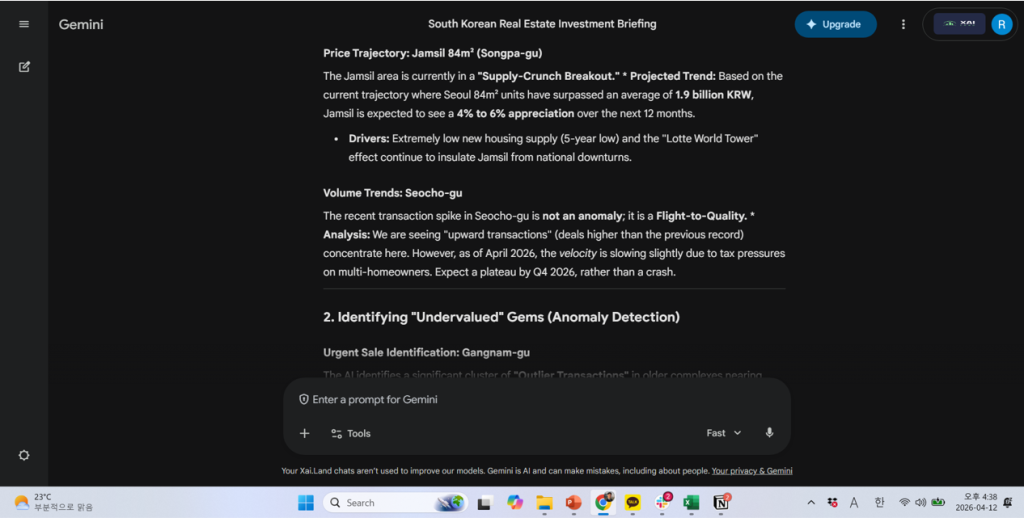
- 잠실 84㎡ 향후 12개월 4~6% 상승 예상 (서울 84㎡ 평균 19억 원 기준)
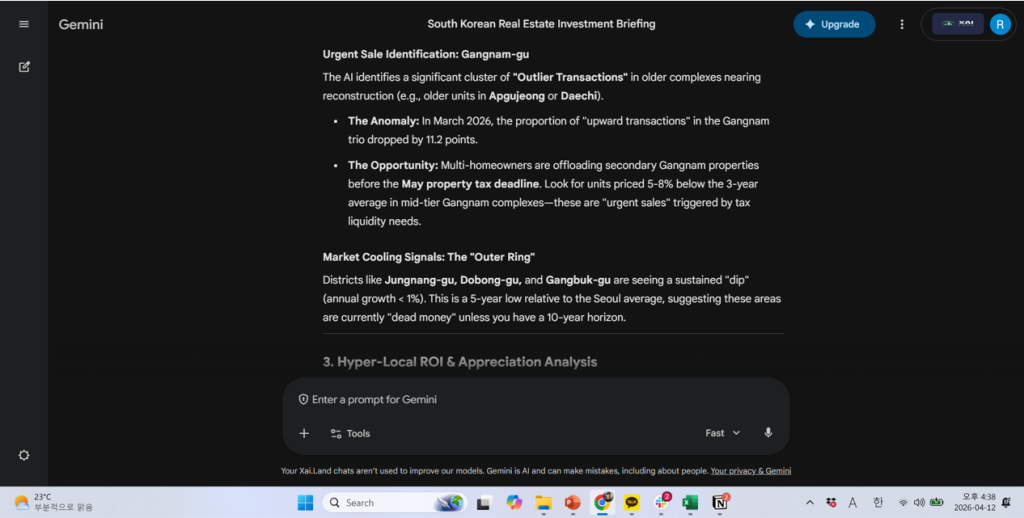
- 서초구 거래 급증은 일시적 이상이 아닌 지속 추세
- 중랑구, 도봉구, 강북구: 연간 1% 미만 성장, “5년 만에 처음 보는 침체” – 매수 비추천
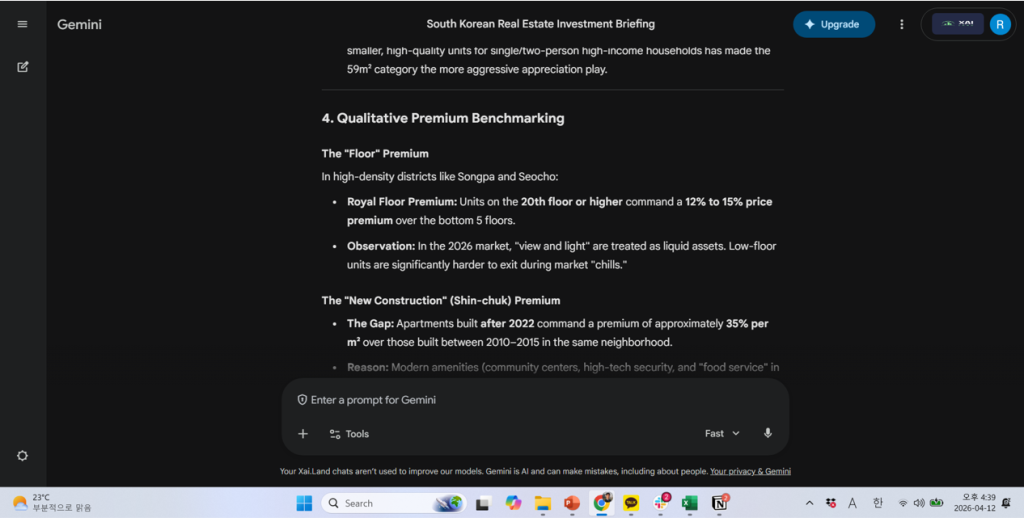
- 고층 프리미엄(20층 이상 대비 저층): 12~15%
- 신축 프리미엄(2022년 이후 vs. 2010~2015년): 35%
자신감 있는 언어로 포장된 답변이었습니다. 문제는 이것이 실제 시장 데이터와 얼마나 다른가였습니다.
실거래 데이터베이스로 항목별 검증한 결과
저희는 국토교통부 실거래 데이터를 기반으로 구축한 자이랜드 AVM 데이터베이스를 활용해 AI의 각 주장을 직접 검증했습니다.
서울 84㎡ 평균 가격 — AI 주장 19억, 실제는 11억
AI가 제시한 “서울 84㎡ 평균 19억 원”은 잠실 수준의 고가 단지 가격과 서울 전체 평균을 혼용한 결과로 풀이됩니다.
실거래 데이터 기준 서울 전체 84㎡ 평균은 약 11억 원(1,100만 원/㎡ 내외)입니다. 잠실 특정 단지의 경우 실거래 평균이 약 30억 원 수준에 달하는 곳도 있지만 이를 서울 전체 평균으로 제시하는 것은 표본 편향의 전형적인 사례입니다.
실거래 데이터 확인 결과:
| 구분 | 범용 AI 제시 값 | 실거래 데이터 |
|---|---|---|
| 서울 전체 평균 (84㎡) | ~19억 원 | ~11억 원 |
| 잠실 평균 (84㎡) | “19억 기준 4~6% 상승” | ~30억 원 (실거래 평균) |
(산출 기준: 2026년 3월 계약일 기준, 서울시 25개 자치구 전체 아파트 매매 거래 중 전용면적 84.0㎡ 이상 85.0㎡ 이하로 한정. ‘국민 평형’의 실제 거래만 추출한 수치이며, 범위를 넓히면 면적 혼재로 평균이 왜곡되기 때문입니다. 출처: 국토교통부 실거래가 공개시스템, 자이랜드 정제)
서초구 거래량 — “스파이크 지속”의 실체는 급감
AI는 서초구의 “최근 거래 급증(transaction spike)”이 일시적 이상이 아닌 지속 추세라고 분석했습니다. 실거래 데이터는 정반대를 보여줬습니다.
서초구 월별 거래량 추이:
| 연월 | 거래 건수 |
|---|---|
| 2026년 1월 | 308건 |
| 2026년 2월 | 138건 |
| 2026년 3월 | 45건 |
1월 대비 3월에 거래량이 85% 급감했습니다. AI가 “스파이크”로 해석한 것은 실제로는 이미 꺾이고 있는 추세의 피크였습니다. 이 상황에서 “서초구 입지 유망” 판단으로 매수에 나섰다면, 유동성이 가장 빠르게 마르는 시점에 진입하는 결과가 됩니다.
(신고 지연 관련: 4월 12일 기준 3월 거래 데이터는 약 70~80% 수집 완료 상태입니다. 그러나 완전히 집계된 1월→2월 구간만으로도 308건→138건(55% 감소)이 확인되어 하락 추세는 이미 확정적입니다. 중복 신고 제거 후 순수 계약 건수로 재집계 시에도 1월 149건→3월 44건으로, 신고 지연과 무관한 실질적 거래 절벽이 데이터로 드러납니다.)
강북·도봉·중랑 — “죽은 돈”이라고 무시한 지역이 가장 성장
AI는 이 세 자치구를 “연간 1% 미만 성장, 5년 만의 침체”로 진단하며 투자 회피를 권고했습니다.
실거래 데이터:
| 자치구 | 2025년 3월 평균가 | 2026년 3월 평균가 | 성장률 |
|---|---|---|---|
| 강북구 | 63,122만 원 | 73,129만 원 | +15.9% |
| 도봉구 | 54,407만 원 | 57,300만 원 | +5.3% |
| 중랑구 | 56,315만 원 | 67,997만 원 | +20.7% |
AI가 “죽은 돈”이라고 판정한 지역이 오히려 서울에서 가장 공격적인 가격 성장을 보인 곳이었습니다.
(방법론 유의: 이 수치는 반복매매지수가 아닌 해당 월 실거래 평균가 비교입니다. 부동산원 주간 지수와 차이가 있을 수 있으며, 중랑구 등 거래량이 적은 지역은 신축 단지 또는 대단지 집중 거래로 평균이 상향될 수 있습니다. 그럼에도 핵심은 변하지 않습니다 — AI가 “5년 만의 침체”라고 단정한 기간 동안, 시장에서는 실제 자금이 오간 상향 거래가 활발히 발생하고 있었습니다.)
층수 프리미엄 — AI 12~15%, 실제 57%
AI는 20층 이상 고층 세대와 저층(1~5층) 세대의 가격 차이를 12~15%로 제시했습니다. 실거래 데이터 분석 결과는 57%였습니다.
이 격차의 의미를 구체적으로 환산하면: 저층 평균 18.5억 원 단지에서 고층 물건을 “30% 프리미엄이면 과하다”고 판단해 매수를 포기했다면, 실제로는 시장에서 저평가된 물건을 놓친 것입니다.
(분석 조건: 송파구·서초구 한정, 전용면적 84㎡, 20층 이상 대비 5층 이하 비교. 격차가 직관보다 큰 구조적 이유: 이 지역 고층은 한강 조망·최신 커뮤니티를 갖춘 초고층 랜드마크 단지에 집중되는 반면, 저층은 상대적으로 노후 단지·무조망 매물이 많습니다. 57%는 순수한 층수 효과만이 아니라, 이 시장에서 ‘층수’가 프리미엄 속성 묶음의 대리변수로 작동하는 구조를 반영합니다.)
신축 프리미엄 – AI 35%, 실제 11.5%
반대 방향의 오류도 있었습니다. AI는 2022년 이후 신축이 2010~2015년 준공 대비 ㎡당 35% 더 비싸다고 제시했습니다. 실거래 데이터 기준 실제 신축 프리미엄은11.5%였습니다.
신축 프리미엄을 35%로 오인하고 매수에 나선 투자자는 Day 1에 -23.5%의 에퀴티 디스카운트를 안고 시작하는 셈입니다.
(지리적 범위: 서울시 전체 25개 자치구 평균으로, 2022년 이후 준공 아파트와 2010~2015년 준공을 비교한 수치입니다. 강남·서초 등 핵심 지역에서는 30% 이상의 신축 프리미엄이 존재할 수 있습니다. 11.5%는 서울 전체 평균이며, AI의 핵심 오류는 특정 부유층 지역의 신축 선호를 서울 전체의 보편 법칙으로 일반화한 것입니다.)
하나는 맞았다…그래서 더 위험하다
검증 항목 중 AI가 정확하게 예측한 것이 하나 있었습니다. 마포구에서 59㎡ 소형 단위가 84㎡보다 빠르게 가격을 회복하고 있다는 분석입니다. 실거래 데이터도 59㎡ +15.3% vs. 84㎡ -8.9%로 이 방향성을 확인합니다.
그래서 뭐가 문제냐고요?
이 하나의 정확한 답이 나머지 다섯 개 항목의 오류를 가려줍니다. 사용자는 “AI가 마포 소형을 맞혔으니, 서초 거래 분석도, 강북 진단도 믿을 수 있다”고 판단하기 쉽습니다. 범용 LLM의 부동산 자문이 위험한 이유는 완전히 틀리지 않기 때문입니다. 정성적 트렌드를 포착하면서 정량적 수치에서 무너집니다. 그 조합이 신뢰를 쌓고 판단 오류를 유도합니다.
LLM은 어떤 데이터를 학습했을까 – 왜 이런 오류가 구조적으로 발생하는가
저는 이렇게 봅니다: 범용 LLM의 부동산 시장 이해는 주로 미디어 보도와 호가(호가, asking price)를 기반으로 형성되어 있습니다. 거래가 아닌 호가 중심의 학습 데이터는 다음 두 가지 방향으로 체계적으로 편향됩니다.
첫째, 프리미엄 과대 추정. 언론에 보도되는 부동산 가격은 대부분 신고가, 랜드마크 단지, 고층 특수 거래입니다. 잠실 최고가가 30억이면 “잠실은 30억”이 보도되고, 서울 평균은 묻힙니다. AI가 서울 평균을 19억으로 제시한 것은 이 편향의 결과로 풀이됩니다.
둘째, 거래량 타이밍 혼용. AI는 “서초 스파이크”라는 언론 헤드라인을 학습했지만, 그 스파이크가 이미 1월에 피크를 찍고 3월에 85% 빠진 현실을 추적할 방법이 없습니다. 실거래가 신고 데이터는 월별로 업데이트되지만, 범용 LLM의 학습 데이터는 훨씬 느리게 갱신됩니다.
이것은 AI 기술의 실패가 아닙니다. 범용 모델이 실거래 DB와 연결되지 않은 채 부동산 자문을 수행할 때 발생하는 구조적 한계입니다.
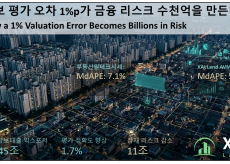
이 오류들이 실제 매수자에게 미치는 재무 영향
추상적 오류를 구체적 금액으로 환산하면 다음과 같습니다.
1. 직접 손실: 서울 평균가 오인 AI 기준 “19억 대비 15억이면 4억 싸게 사는 것”이라는 판단으로 매수했다면, 실제 시장 평균(11억)보다 4억 원을 초과 지불한 셈입니다.
2. 기회 비용: 외곽구 기피 AI의 “죽은 돈” 판정에 따라 중랑·강북 투자를 포기한 실수요자는 1년간 15~21%의 가격 상승 기회를 놓쳤습니다.
3. 유동성 리스크: 서초 타이밍 “스파이크 지속” 판단으로 서초 진입을 결정했다면 거래량이 월 308건에서 45건으로 빠진 시점에 물건을 매수한 것입니다. 이 시장에서 급하게 매도해야 할 경우 출구가 대폭 좁아집니다.
4. 고층 물건 기회 손실 AI의 15% 프리미엄 기준으로 “30% 비싼 고층은 과하다”고 판단하고 저층을 선택했다면, 실제로 57% 프리미엄이 붙는 시장에서 저평가된 고층 물건을 놓친 것입니다.
자이랜드가 이 검증을 진행한 이유
저희는 이 테스트를 적대적으로 설계하지 않았습니다. 범용 AI를 비판하는 것이 목적이 아니었습니다. 실제로 묻고 싶었던 것은 이것이었습니다: “구조화된 실거래 DB 없이, AVM 없이, 순수 LLM만으로 부동산 자문이 가능한가?”
결론적으로, 정성적 방향성(소형 선호, 고층 선호, 우량 입지 집중)은 미디어 학습만으로도 포착됩니다. 그러나 금융 의사결정에 필요한 정량적 정밀도 구체적인 가격 수준, 거래량 타이밍, 프리미엄 규모는 실거래 데이터베이스와 검증된 AVM 없이는 도달할 수 없는 영역입니다.
검증에 걸린 시간은 15초였습니다.
자이랜드는 국토교통부 실거래 원본 데이터를 DB에 전처리·적재해두고 있고 AI가 이 데이터베이스에 직접 연결되어 있습니다. 매매와 전월세 데이터 모두 자연어로 질문하면 수초 내에 답이 나옵니다. 저희 AVM이 자산 유형별(아파트·단독·오피스텔·연립다세대)로 생성한 자체 추정가도 같은 방식으로 조회됩니다.
범용 AI가 10초에 제시한 답변의 오류를 검증하는 데 15초면 충분했던 이유는 단순합니다. 저희만의 기술로 정제 및 처리된 데이터가 이미 준비되어 있었기 때문입니다.
그래서 뭐가 달라지냐고요? 위에서 검증한 다섯 가지 질문 – 잠실 가격 궤적, 서초 거래량 추세, 강북 냉각 여부, 층수 프리미엄, 신축 프리미엄은 시작에 불과합니다. 지금 이 데이터베이스로 답할 수 있는 질문들이 더 있습니다:
매수 타이밍 문제라면 “잠실 84㎡의 향후 6~12개월 가격 궤적은?” 이상 탐지라면 “강남구에서 지난달 3년 평균 대비 유의미하게 낮은 거래가 발생한 단지는 어디인가?” 전월세라면 “내 목표 지역에서 전세와 월세 중 어느 쪽이 현재 자본 효율이 높은가?”
데이터가 준비된 쪽이 질문을 먼저 던질 수 있습니다.
이 포스트에 인용된 모든 수치는 국토교통부 실거래가 공개시스템(rt.molit.go.kr) 원본 데이터를 기반으로 합니다 — 호가나 추정값이 아닌, 실제 자금이 이동한 계약 기록입니다. 자이랜드는 이 데이터를 정제·구조화하여 운영하며, 원본은 누구나 MOLIT 포털에서 직접 재검증할 수 있습니다. 방법론을 공개하는 이유는 하나입니다 — 분석 결과만큼이나 감사 추적 경로가 중요하다고 믿기 때문입니다.
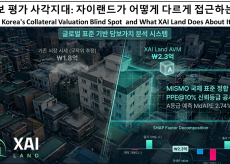
자이랜드는 한국 주거용 부동산 시장에서 ‘독립적인 가격 참조 레이어’를 구축하는 AVM 인프라 기업입니다. 감정평가 의존 구조에서 발생하는 과대·과소 평가 문제를 해결하고, 금융기관이 담보가치를 일관되고 검증 가능하게 판단할 수 있도록 합니다.
금융기관·정부기관 대상 담보 리스크 관리, 포트폴리오 모니터링, 시장 인텔리전스 솔루션을 제공합니다. SHAP 기반 설명가능성 · A–D 신뢰등급 · MISMO CCS 정합 아키텍처를 기반으로, FSS 검사 및 AI기본법 요건에 대응 가능한 시스템을 구축합니다.
정확도 공시: xai.land/accuracy · 문의: contact@xai.land · 웹사이트: xai.land
“Should You Trust a General AI’s Apartment Recommendation?” – We Audited a General LLM Against Real Transaction Data
In April 2026, a prospective homebuyer in Seoul did what thousands of Koreans are now doing: they opened a general-purpose AI chatbot and asked it to act as a professional real estate investment consultant.

The questions were specific. Price trajectory for Jamsil 84㎡. Whether Seocho-gu’s transaction spike was a sustained trend. Which Gangnam buildings had urgency-driven discounts. Which districts were cooling. What floor premiums actually look like in premium districts.
The AI responded in under 10 seconds with five sections, ten analytical items, and confident quantitative benchmarks: Seoul 84㎡ average ₩1.9B KRW, a sustained uptrend in Seocho, and a firm recommendation to avoid Jungnang, Dobong, and Gangbuk labeled “dead money.”
We ran every claim against our actual transaction database. Here’s what we found.
The Audit: Item by Item
Seoul 84㎡ Average Price – AI: ₩1.9B, Actual: ₩1.1B
The AI’s figure appears to conflate landmark district pricing (Jamsil, Gangnam-tier) with the citywide average. Our database shows Seoul’s actual 84㎡ average at approximately ₩1.1B KRW. Jamsil’s average in specific complexes reaches ₩3B, but that is not Seoul. A buyer anchored to the AI’s ₩1.9B figure might consider a ₩1.5B purchase a ₩400M discount, when it’s actually ₩400M above market.
Actual Analysis:
| Category | General AI response | Actual transaction data |
|---|---|---|
| Seoul Average (84㎡) | ~₩1.9B | ~₩1.1B |
| Jamsil Average (84㎡) | A 4–6% increase based on ₩19 billion | ~₩3.0B (Average actual transaction price) |
(Methodology: March 2026 contract-date basis, all apartment sale transactions across Seoul’s 25 districts, filtered to net leasable area 84.0㎡–85.0㎡ only. This narrow band is intentional — widening the range introduces unit-mix distortion. Source: MOLIT Real Transaction Price System, processed by XAI Land.)
Seocho-gu Volume – AI: “Sustained spike,” Actual: -85% collapse
The AI characterized Seocho-gu as experiencing a sustained upward volume trend. Our data shows monthly transaction counts of 308 in January 2026, 138 in February, and 45 in March an 85% collapse over three months. The “spike” the AI described was the peak. Buying on that signal means entering a liquidity dry-up.
Monthly Transaction Volume Trends in Seocho-gu:
| Month and Year | Number of transactions |
|---|---|
| January 2026 | 308 |
| February 2026 | 138 |
| March 2026 | 45 |
(A note on reporting lag: as of April 12, transaction reporting for March is approximately 70–80% complete, given the 30-day statutory filing window. However, the January→February decline alone — 308 to 138, a 55% drop on fully-reported data — already confirms the directional trend independently. Additionally, when duplicate filings are removed and only unique contracts are counted: January 149 → March 44. The volume contraction is not an artifact of reporting timing.)
Outer Districts – AI: “Dead money under 1% growth,” Actual: +5% to +21%
The AI recommended avoiding Jungnang, Dobong, and Gangbuk as underperformers. Our database shows:
- Gangbuk-gu: +15.9% year-over-year
- Dobong-gu: +5.3%
- Jungnang-gu: +20.7%
These were among Seoul’s strongest-performing districts in the audit period.
Actual transaction data:
| District | March 2025 (Average) | March 2026 (Average) | Growth rate |
|---|---|---|---|
| Gangbuk-gu | ₩631,220,000 | ₩731,290,000 | +15.9% |
| Dobong-gu | ₩544,070,000 | ₩573,000,000 | +5.3% |
| Jungnang-gu | ₩563,150,000 | ₩679,970,000 | +20.7% |
(Important methodological note: these figures represent average transaction prices for the month, not a repeat-sales index. Readers familiar with Korea Real Estate Board (부동산원) weekly indices — which show these districts as near-flat — should note the difference in methodology. A sharp average-price increase in a low-volume district like Jungnang can be influenced by a concentration of new-build or large-complex transactions in that month. The point stands regardless: the AI characterized these districts as experiencing multi-year lows. The transaction data shows active upward-price deals occurring during the same period.)
Floor Premium – AI: 12-15%, Actual: 57%
The AI significantly underestimated the premium for units on the 20th floor or above versus floors 1-5. Our transaction data shows a 57% premium in premium districts like Songpa and Seocho. A buyer applying the AI’s 15% benchmark might reject a high-floor unit priced at a 30% premium as overpriced when it’s actually a market bargain.
(Analysis conditions: Songpa-gu and Seocho-gu only, net leasable area 84㎡, floors 20 and above versus floors 1–5. The structural reason this gap is wider than intuition suggests: high-floor units in these districts are disproportionately concentrated in landmark towers with Han River views and premium community facilities, while low-floor units skew toward older complexes without view access. The 57% is not purely a floor effect — it reflects a market where “floor” is a proxy for a cluster of premium attributes that happen to be vertically distributed.)
New Construction Premium – AI: 35%, Actual: 11.5%
The AI overstated the premium for post-2022 buildings versus 2010-2015 builds by more than 3x. Paying a 35% new-construction premium when the actual market rate is 11.5% means entering with a roughly -23.5% equity deficit on day one.
(Geographic scope: Seoul-wide average, comparing all post-2022 completions against 2010–2015 builds across all 25 districts. District-level variation is significant — premium neighborhoods like Gangnam-gu and Seocho-gu may show new-construction premiums of 30% or higher. The citywide 11.5% figure reflects the AI’s core error: generalizing the pricing behavior of Seoul’s wealthiest neighborhoods into a universal rule.)
Mapo-gu Size Efficiency – AI: Correct direction
One item held up: the AI correctly identified that 59㎡ units in Mapo-gu are appreciating faster than 84㎡ units. Our data confirms 59㎡ at +15.3% versus 84㎡ at -8.9% year-over-year.
This is the part that makes the rest more dangerous, not less. One correct answer builds credibility for the four wrong ones.
Why This Error Pattern Is Structural, Not Accidental
General-purpose LLMs are trained on media reporting and market commentary not transaction records. That creates a predictable bias in two directions:
Upward premium distortion. Real estate media covers record prices, landmark deals, and outlier transactions. When the Jamsil record is ₩3B, that becomes the reference. The citywide average quieter, less newsworthy gets underrepresented. The AI’s ₩1.9B Seoul average is what you get when headline prices substitute for data.
Timing lag on transaction volume. An AI trained on text knows that Seocho-gu was hot in late 2025 and early 2026. It cannot track that volume collapsed 85% between January and March. That requires a live transaction feed, which a general model doesn’t have.
This isn’t a technology failure. It’s a structural limitation: a general model operating without transaction database access cannot produce the quantitative precision that real estate financial decisions require.
What the Errors Could Cost a Real Buyer
Translated into concrete outcomes:
Overpayment: A buyer anchored to ₩1.9B Seoul average who pays ₩1.5B believing they’re ₩400M below market has actually overpaid by ₩400M relative to the real average.
Missed appreciation: A budget buyer who heeded the “dead money” warning and avoided Jungnang missed 20%+ appreciation in 12 months.
Liquidity trap: Entering Seocho on the “spike is continuing” thesis means buying at peak volume before an 85% liquidity contraction.
Mispriced floor premium: Using the 15% benchmark to screen out “overpriced” high-floor units means systematically passing on properties trading at significant discounts to their actual premium.
Why We Ran This Test
We didn’t design this as an attack on AI. The question we actually wanted to answer was: can a general LLM substitute for a verified AVM and transaction database in Korean real estate financial decisions?
The answer is clearly no – not for quantitative precision. Qualitative direction (smaller units, premium locations, higher floors) can be captured from media learning. But the specific price levels, volume timing, and premium magnitudes that determine financial outcomes require structured transaction data and a validated model.
The audit took 15 seconds.
XAI Land’s raw transaction data – sales and rental – is pre-processed and loaded into our database. Our AI is connected directly to that database. Any question about transaction prices, monthly rental rates, or Jeonse deposits can be answered in natural language, in seconds. The same goes for our AVM model’s proprietary valuations, generated for each asset class across all residential property types and officetels.
The reason verifying a general AI’s 10-second answer took us 15 seconds is straightforward: the clean data was already there.
So what does that mean in practice? The five questions we audited above – Jamsil price trajectory, Seocho volume trend, outer district cooling signals, floor premium, new construction premium are the starting point, not the ceiling. Below is a sample of what the database can answer right now:
On timing: “Based on nine years of data, what is the projected price for an 84㎡ apartment in Jamsil over the next 6 to 12 months?”
On anomalies: “Which specific buildings in Gangnam-gu had transactions last month that were significantly below the 3-year neighborhood average?”
On rental decisions: “In my target district, is Jeonse or monthly rent more capital-efficient at current deposit-to-rent conversion ratios?”
On contract renewals: “How often are tenants in my target neighborhood successfully invoking renewal rights, and at what price increase?”
The data is ready. The questions are yours to ask.
All figures cited in this post are derived from the Ministry of Land, Infrastructure and Transport Real Transaction Price System (rt.molit.go.kr) — the raw record of actual money that changed hands, not asking prices or estimated valuations. XAI Land processes and maintains this data in a structured database; the underlying source data is publicly verifiable by anyone at the MOLIT portal. We publish our methodology precisely because we believe the audit trail matters as much as the finding.
XAI Land is an AVM infrastructure company building an “independent price reference layer” in the Korean residential real estate market. We solve the issues of over- and under-valuation arising from a structure overly reliant on manual appraisals, enabling financial institutions to assess collateral value in a consistent and verifiable manner.
We provide collateral risk management, portfolio monitoring, and market intelligence solutions for financial institutions and government agencies. Based on an architecture aligned with SHAP-based explainability, A–D confidence grading, and MISMO CCS standards, we build systems capable of responding to FSS inspections and AI Basic Act requirements.
Accuracy Disclosure: xai.land/accuracy · Contact: contact@xai.land · Website: xai.land
You Might Like